Image Details
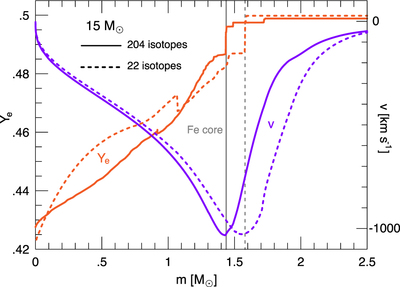
Caption: Figure 25.
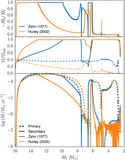
Radial velocity and ﹩{Y}_{{\rm{e}}}﹩ profiles at the onset of core collapse for the Mi = 15 ﹩{{\rm{M}}}_{\odot }﹩ model. Dashed curves show the results using a 22 isotope network and solid curves show the results using a 204 isotope network. Both models are evolved from the pre main-sequence to the onset of core collapse with their respective reaction network. The vertical gray lines mark the mass of the iron core as defined by the ﹩{Y}_{{\rm{e}}}﹩ jump.
Other Images in This Article


Show More
Copyright and Terms & Conditions
© 2015. The American Astronomical Society. All rights reserved.
Copyright ©
2025 Astronomy Image Explorer. All Rights Reserved.