Image Details
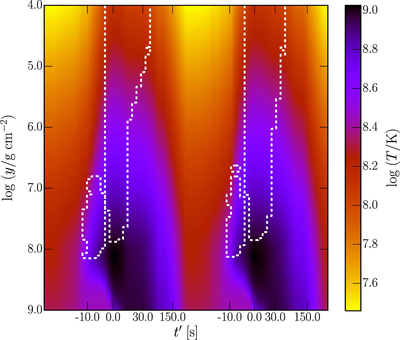
Caption: Figure 21.
Kippenhahn plot during two X-ray bursts for the rp_305 net with the solar metallicity accretion model. The x-axis values are times relative to the peak of each burst, note the nonlinearity of the scale. The y-axis values are the column depth and the color coding shows the temperature of the NS envelope. The dashed contours show the extent of the convective regions.
Other Images in This Article


Show More
Copyright and Terms & Conditions
© 2015. The American Astronomical Society. All rights reserved.
Copyright ©
2025 Astronomy Image Explorer. All Rights Reserved.