Image Details
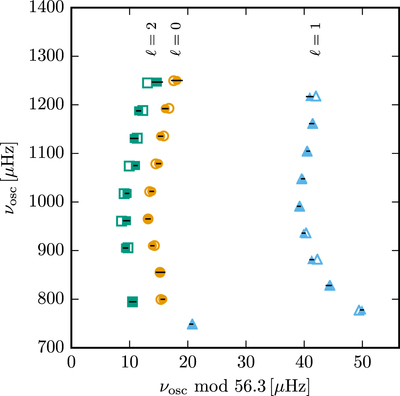
Caption: Figure 12.
Echelle diagram for the subgiant star HD 49385. Observed frequencies are shown as filled circles (﹩{\ell }=0﹩), triangles (﹩{\ell }﹩ = 1) and squares (﹩{\ell }﹩ = 2); black horizontal lines indicate the 1σ error bars. Calculated frequencies of the best-fit model are overplotted as the corresponding open symbols.
Other Images in This Article


Show More
Copyright and Terms & Conditions
© 2015. The American Astronomical Society. All rights reserved.
Copyright ©
2025 Astronomy Image Explorer. All Rights Reserved.