

Image Details
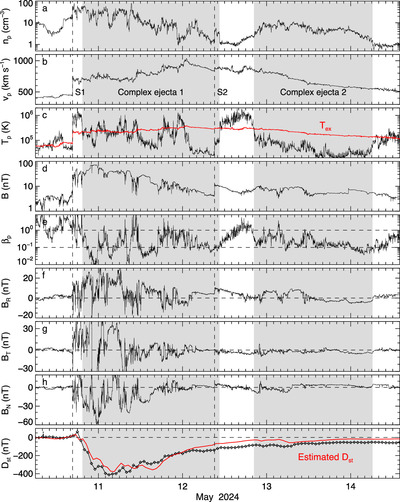
Caption: Figure 3.
Solar wind parameters observed at Wind and measured D st index. From top to bottom, the panels show the proton density (a), bulk speed (b), proton temperature (c), magnetic field strength (d), proton β (e), magnetic field components (f)–(h), and D st index (i). The shaded regions indicate the intervals of the two complex ejecta, and the vertical dashed lines mark the associated shocks. The red curve in panel (c) denotes the expected proton temperature calculated from the observed speed (R. E. Lopez 1987; I. G. Richardson & H. V. Cane 1995). The red curve in panel (i) represents the estimated D st index by combining the formulas of R. K. Burton et al. (1975) and T. P. O’Brien & R. L. McPherron (2000).
Other Images in This Article
Copyright and Terms & Conditions
© 2024. The Author(s). Published by the American Astronomical Society.

