

Image Details
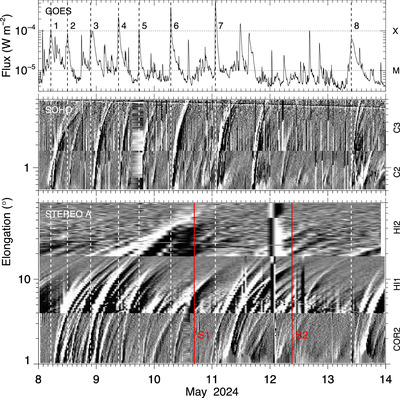
Caption: Figure 2.
Full halo eruptions on May 8–13. Top: GOES X-ray flux at 1–8 Å. Middle: time-elongation maps from LASCO of SOHO (at a position angle of 90° measured clockwise from the solar north). Bottom: time-elongation maps from SECCHI of STEREO A (at a position angle of 270° clockwise from the solar north). The vertical dashed lines indicate the peak times of the associated flares, with the numbers labeling the eruptions as in Table 1. The red vertical lines mark the observed arrival times of the shocks at the Earth.
Other Images in This Article
Copyright and Terms & Conditions
© 2024. The Author(s). Published by the American Astronomical Society.

Copyright ©
2026 Astronomy Image Explorer. All Rights Reserved.
