Image Details
Caption: Figure 5.
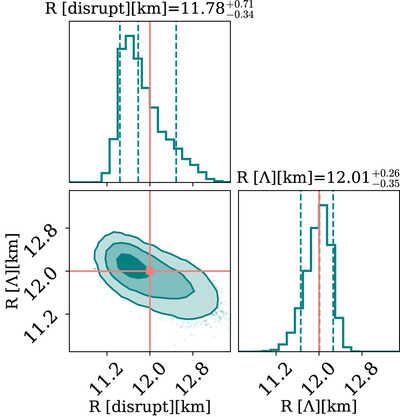
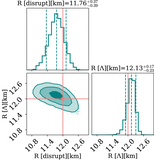
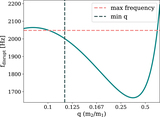
Posterior distribution for the neutron star radius recovered using the tidal disruption and the tidal deformability for a system with a mass ratio of 0.2. The different shades show the 1σ, 2σ, and 3σ intervals, while the 90% confidence intervals are shown in the 1D histograms. Like the q = 1/3 system, the radius is better constrained using the tidal deformability compared with using the tidal disruption. The radius inferred from the tidal disruption is accurate to ≈9%, while the radius inferred through the tidal deformability is accurate to ≈5% at 90% credibility.
Other Images in This Article

Copyright and Terms & Conditions
© 2023. The Author(s). Published by the American Astronomical Society.
Copyright ©
2025 Astronomy Image Explorer. All Rights Reserved.