Image Details

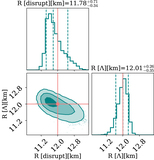
Caption: Figure 3.
Posterior distribution for the neutron star radius recovered using the tidal disruption and the tidal deformability. The different shades show the 1σ, 2σ, and 3σ intervals, while the 90% confidence intervals are shown in the 1D histograms. While both results are consistent with the simulated radius of 12 km, the radius is better constrained using the tidal deformability compared with using the tidal disruption. The radius inferred from the tidal disruption is accurate to ≈7%, while the radius inferred through the tidal deformability is accurate to ≈3% at 90% credibility.
Other Images in This Article

Copyright and Terms & Conditions
© 2023. The Author(s). Published by the American Astronomical Society.
Copyright ©
2025 Astronomy Image Explorer. All Rights Reserved.