Image Details
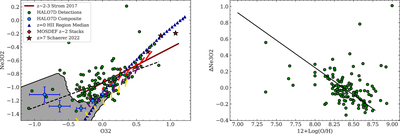
Caption: Figure 4.
Left: Ne3O2 vs. O32 for individual HALO7D galaxies (green circles) and composite HALO7D spectra (blue circles) compared with 2 < z < 3 composite spectra from J20 (red diamonds) and individual measurements from S17 (maroon line). We also include median values for local H II regions (blue triangles) assembled in J20 from Pilyugin & Grebel (2016), Croxall et al. (2016), and Toribio San Cipriano et al. (2016). The gray shaded region indicates the 90% boundary for local SDSS galaxies measured in S17. The dashed black line shows a linear fit of the HALO7D points. Individual [NeIII]λ3869 detections in HALO7D exhibit comparable ionization properties to (typically more massive) 2 < z < 3 galaxies but with high scatter that may be related to metallicity variations. The red, purple, and yellow curves give the BPASS models from S17. Right: the Ne3O2 offset from the linear Ne3O2-O32 fit as a function of the R23 metallicity.
Other Images in This Article
Copyright and Terms & Conditions
© 2023. The Author(s). Published by the American Astronomical Society.