Image Details
Caption: Figure 1.
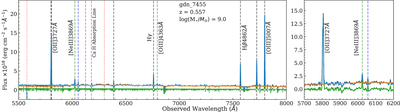
Left: example spectrum of a HALO7D dwarf emission-line galaxy. The blue solid line gives the observed spectrum. The orange solid line shows the continuum estimate, and the green solid line shows the continuum-subtracted spectrum. Prominent emission lines are labeled and indicated by vertical dashed lines. Black and gray dashed lines indicate strong and/or Balmer series emission lines. Green dashed lines indicate typically fainter ionized metal lines, and the blue dashed line shows the location of a blend of the faint He I λ3889 and Hζ emission lines. The two magenta dashed lines show the locations of the Ca H and K stellar absorption lines though these features are not prominent in this spectrum, which has little stellar continuum due to its low stellar mass as well as a likely young stellar population. Right: a zoom-in on the spectrum showing the [OII]λλ3727,3729 doublet, as well as the [NeIII]λ3869 emission line and He I–Hζ blend.
Other Images in This Article
Copyright and Terms & Conditions
© 2023. The Author(s). Published by the American Astronomical Society.