Image Details
Caption: Figure 2.
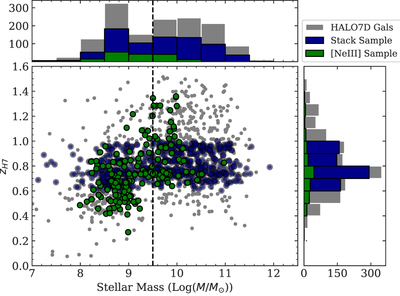
The stellar mass vs. redshift distribution of the HALO7D galaxy sample. The vertical dashed line separates the dwarf and massive galaxy populations, defined at ﹩\mathrm{log}({M}_{\star }/{M}_{\odot })=9.5﹩. The gray points and histograms indicate the overall sample of galaxies for which a good redshift fit was obtained from spectral features, as described in Pharo et al. (2022). The green points and histograms denote the subsample of galaxies with significant (S/N > 3) detections of the [NeIII]3869 and [OII]3727,3729 emission lines. This yields a sample of 167 galaxies (out of 1432 in the HALO7D catalog), including 112 dwarf galaxies (out of 646), with a redshift range of 0.3 < z < 1.4. The dark blue points and histograms indicate the emission-line galaxy sample used for composite galaxy stacking, described in Section 2.4.
Other Images in This Article
Copyright and Terms & Conditions
© 2023. The Author(s). Published by the American Astronomical Society.