Image Details
Caption: Figure 4.
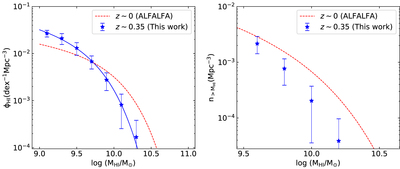
(A) The HIMF at z ≈ 0.35, inferred by combining our M H I–M B relation with the ALHAMBRA B-band luminosity function (López-Sanjuan et al. 2017). The blue stars represent the inferred HIMF of blue galaxies at z ∼ 0.35, while the dashed line shows the ALFALFA HIMF at z ≈ 0 (Jones et al. 2018). (B) The inferred number density of blue star-forming galaxies at z ≈ 0.35 above a given HI mass, as a function of ﹩\mathrm{log}({{\rm{M}}}_{{\rm{H}}\,{\rm\small{I}}})﹩. The dashed curve shows the same quantity in the local universe, from the HIMF of ALFALFA survey (Jones et al. 2018).
Other Images in This Article
Copyright and Terms & Conditions
© 2022. The Author(s). Published by the American Astronomical Society.