Image Details
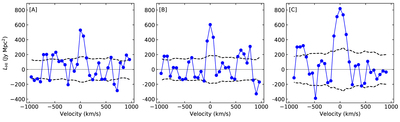
Caption: Figure 1.
The stacked HI 21 cm emission spectra (in luminosity density) for blue galaxies in the three M B bins, [A] − 16.0 ≥ M B > − 17.6, [B] −17.6 ≥ M B > −19.2, and [C] − 19.2 ≥ M B ≥ − 22.0. The dashed black curves in each panel show the rms noise in the corresponding velocity planes of the stacked spectral cubes. See text for details.
Other Images in This Article
Copyright and Terms & Conditions
© 2022. The Author(s). Published by the American Astronomical Society.
Copyright ©
2025 Astronomy Image Explorer. All Rights Reserved.