Image Details
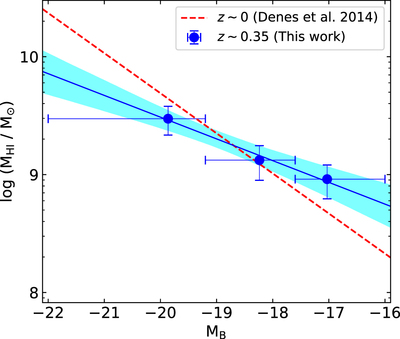
Caption: Figure 2.
The M H I–M B relation for blue galaxies at z ∼ 0.35: The solid blue circles show our estimates of ﹩\langle \mathrm{log}({{\rm{M}}}_{{\rm{H}}\,{\rm\small{I}}})\rangle ﹩ values in blue galaxies in the three M B bins at z ≈ 0.35 plotted against the median M B values. The error bars are estimated by jackknife resampling. The horizontal error bars show the bin widths. The solid black line shows the best-fit M H I–M B scaling relation at z ≈ 0.35, while the blue shaded region shows the 68% confidence interval around the scaling relation. The red dashed line indicates the M H I–M B relation at z ≈ 0 (Dénes et al. 2014).
Other Images in This Article
Copyright and Terms & Conditions
© 2022. The Author(s). Published by the American Astronomical Society.