Image Details
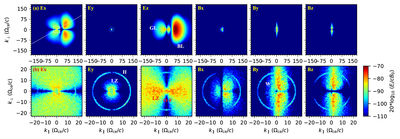
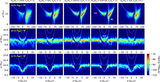
Caption: Figure 2.
Intensity maps of the six field components in the wave-vector k space for Case R. Right columns of panels are the zoomed-in version of the square region plotted in the top-left panel. The dashed line indicates the propagation angle of (θ = 30°) along which the ω, k dispersion maps are plotted in Figure 3.
Other Images in This Article
Copyright and Terms & Conditions
© 2022. The Author(s). Published by the American Astronomical Society.
Copyright ©
2026 Astronomy Image Explorer. All Rights Reserved.