Image Details
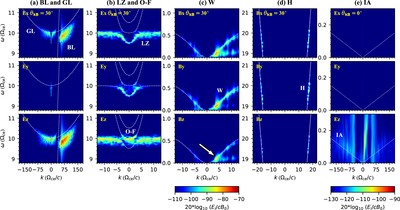
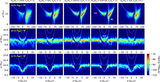
Caption: Figure 3.
Dispersion diagrams of (Ex, Ey, Ez) for the BL (a), GL and O–F modes (b), those of (Bx, By, Bz) for the W (c) and H modes (d), and those of (Ex, Ey, Ez) for the IA mode. Overplotted lines are corresponding dispersion curves given by the magnetoionic theory. The straight dashed line in panel (a) represents the beam mode. The arrow indicates the spectral location selected to plot the resonance curve (Figure 1) for θ = 30° (see Figure 1(d)) for the W mode. The video begins at θ = 0° and advances 5° at a time up to θ = 90°. The real-time duration of the video is 5 s.
(An animation of this figure is available.)
The video/animation of this figure is available in the online journal.
Other Images in This Article
Copyright and Terms & Conditions
© 2022. The Author(s). Published by the American Astronomical Society.