Image Details
Caption: Figure 5.
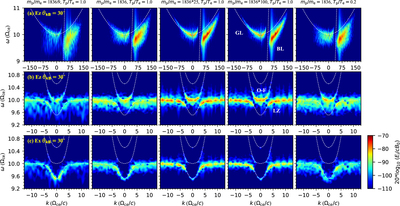
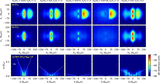
The ω–k spectra along selected propagating directions to illustrate the dispersion relation and intensity distribution of the BL, GL, and O–F modes. The video begins at θ = 0° and advances 5° at a time up to θ = 90°. The real-time duration of the video is 5 s.
(An animation of this figure is available.)
The video/animation of this figure is available in the online journal.
Other Images in This Article
Copyright and Terms & Conditions
© 2022. The Author(s). Published by the American Astronomical Society.
Copyright ©
2024 Astronomy Image Explorer. All Rights Reserved.