Image Details
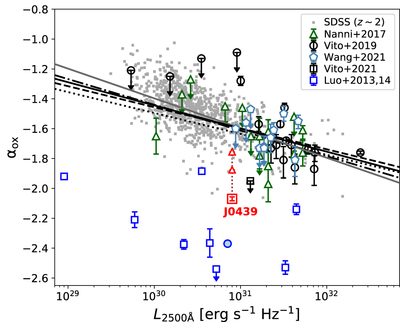
Caption: Figure 3.
Optical-to-X-ray spectral slope αox vs. 2500 Å luminosity. Our measurement from J0439+1634 is shown in red, compared with values from quasar samples at similar redhsift and lower redshift. The two red triangles are the αox values accounting for the intrinsic absorption based on Γ-fixed (lower value) and Γ-free (upper value) model fitting. For high-redshift comparisons, we show individual measurements at 5.5 < z < 6 from Nanni et al. (2017), 6 < z < 6.5 from Vito et al. (2019), and z > 6.5 from Wang et al. (2021). We also include the new upper limit (black square) from a z = 6.515 quasar in Vito et al. (2021). The low-redshift SDSS quasar sample (gray dots) is generated based on the L2–10 keV from Timlin et al. (2020) and L2500 Å from Wang et al. (2021). The relations in the literature are plotted as black solid line (Nanni et al. 2017), gray solid line (Timlin et al. 2020), dashed line (Lusso & Risaliti 2017), dotted line (Just et al. 2007), and dashed–dotted line (Martocchia et al. 2017).The blue squares are the measurements for low-redshift BAL quasars from Luo et al. (2014). Among the sample in Luo et al. (2014), the quasar PG0043+03 is not detected, and it has been updated in Kollatschny et al. (2016) (blue filled circle). All measurements have been corrected to the cosmology adopted in this work.
Other Images in This Article
Copyright and Terms & Conditions
© 2022. The Author(s). Published by the American Astronomical Society.