Image Details
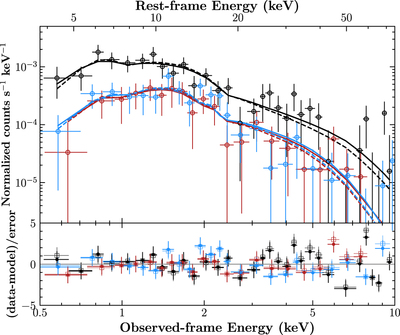
Caption: Figure 2.
The XMM-Newton EPIC spectra of quasar J0439+1634. The upper panel shows the observed counts from the pn camera (black), MOS1 (red), and MOS2 (blue). The solid lines represent the spectral fits using an absorbed power-law model consistent of a power-law model, Galactic absorption, and quasar intrinsic absorption, with the assumption of an intrinsic photon index of Γ = 1.9 (Nanni et al. 2017). The dashed lines denote the spectral fits with a free Γ (see details of spectral fitting in Section 3.2). The bottom panel shows the residuals, with filled circles for the fixed-Γ fits and open squares for the Γ-free fits. The spectral fitting is applied to the spectra grouped to one count per bin, and the data have been rebinned for plotting purpose here using XSPEC.
Other Images in This Article
Copyright and Terms & Conditions
© 2022. The Author(s). Published by the American Astronomical Society.