Image Details
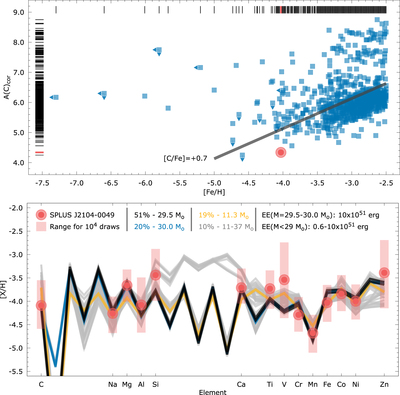
Caption: Figure 3.
Upper panel: carbon abundances—A(C)—as a function of the metallicity–[Fe/H]—for SPLUS J2104−0049 (filled circle) and the literature compilations JINAbase (Abohalima & Frebel 2018) and SAGA (Suda et al. 2008) (filled squares). The solid line represents the current criteria for CEMP stars ([C/Fe] = +0.7). Upper limits are only shown for [Fe/H] ≤ −4.0. Stripe-density profiles are also shown, with the values for SPLUS J2104−0049 highlighted. The upper panel is also available as a Bokeh-generated interactive figure. Hovering the mouse over any point will reveal the underlying data including the name, atmospheric parameters, carbon abundances, upper limit flags, and source. Other functionalities are available via the buttons at the top of the interactive figure. Hovering the mouse over each will reveal its functionality, i.e., panning, zooming, reset. The underlying data set is also available in machine-readable format via the figure data file link. A bigger version that will be updated as more data become available is available at http://vmplacco.github.io/files/acfeh.html. Lower panel: best model fits for SPLUS J2104−0049. The solid lines show the theoretical predictions from the Heger & Woosley (2010) znuc2012.S4 models, color coded by mass and occurrence fraction within the 104 simulations. The explosion energies (EEs) are also listed. The solid circles are the measured abundances for SPLUS J2104−0049, and the shaded areas mark the range of simulated abundances.
An interactive version of this figure is available in the online journal.
Other Images in This Article
Copyright and Terms & Conditions
© 2021. The American Astronomical Society. All rights reserved.