Image Details
Caption: Figure 1.
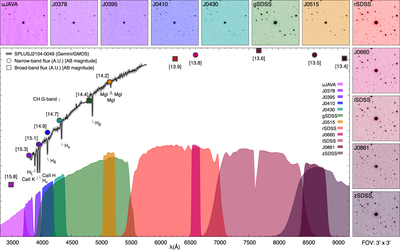
Outside panels: 12-band S-PLUS images for SPLUS J2104−0049, retrieved from the Astro Data Lab. The field of view is 3′ × 3′, with the north direction up and east to the left. The color of each image is based on the central wavelength of the Javalambre filters, which are named at the top left part of each image. Main panel: transmission curves measured for the set of 12 Javalambre filters, which include the effect of the entire system (sky, mirrors, lenses, and CCD). Also shown are the Gemini/GMOS spectrum (black solid line), the fluxes in the narrowband (filled circles) and broadband (filled squares) filters—calculated from the AB magnitudes (in square brackets). The Gemini/GMOS spectrum is available as the data behind the Figure. The transmission curve data can be obtained from https://github.com/splus-survey/filter_curves.
(The data used to create this figure are available.)
Other Images in This Article
Copyright and Terms & Conditions
© 2021. The American Astronomical Society. All rights reserved.