Image Details
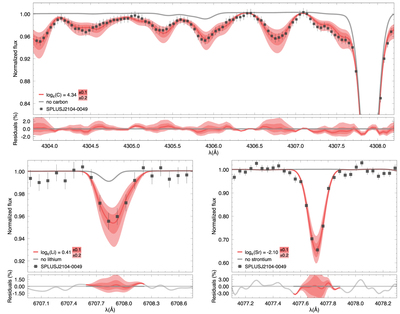
Caption: Figure 2.
Spectral syntheses for the determination of carbon (upper panel), lithium (lower left panel), and strontium (lower right panel) abundances. The top panel of each plot shows the best-fit syntheses (red lines) and uncertainties (±0.1 and ±0.2 dex—shaded regions) compared to the observed spectra (points). Also shown are syntheses after removing the contributions from specific elements (gray lines).The bottom panels show the percent residuals between the observed spectra and the syntheses.
Other Images in This Article
Copyright and Terms & Conditions
© 2021. The American Astronomical Society. All rights reserved.
Copyright ©
2024 Astronomy Image Explorer. All Rights Reserved.