Image Details
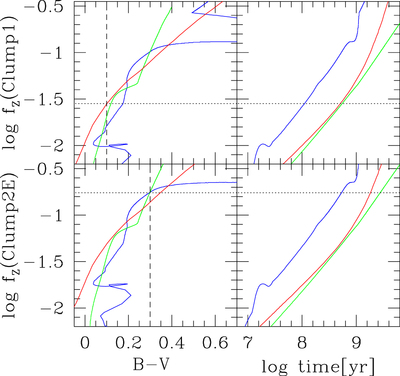
Caption: Figure 3.
Mass fraction of metals fZ produced in situ for an instantaneous burst (blue lines), a burst with exponential decay (red lines), and a continuous star formation model (green lines) as a function of optical colors (left panels) and time (right panels). Each model for both Clump1 (top panels) and Clump2E (bottom panels) is normalized as to produce an apparent magnitude μB = 29 at any time after star formation switches on. The dashed lines indicate the maximum B − V optical color of the clumps, and the dotted line ﹩{f}_{Z}^{\max }﹩, the highest value of fZ compatible with B − V.
Other Images in This Article

Copyright and Terms & Conditions
© 2021. The American Astronomical Society. All rights reserved.
Copyright ©
2026 Astronomy Image Explorer. All Rights Reserved.