Image Details
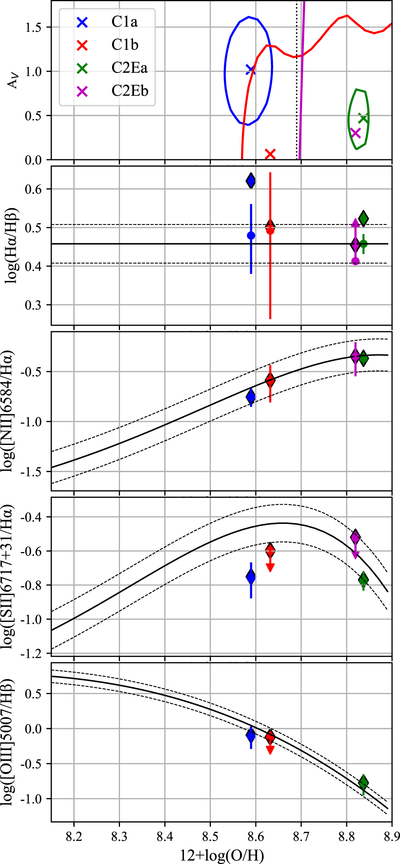
Caption: Figure 2.
Dust visual extinction and gas-phase metallicity for each H II region, color-coded as in the legend. In the top panel we show the best-fitting values (cross) and 1σ confidence levels of AV; the dotted line shows the solar metallicity (12 + log(O/H) = 8.69). The four bottom panels refer to relevant strong line ratios. Diamonds show the observed values of the line ratio plotted at the best-fitting value of metallicity. The Hα/Hβ ratio is computed for Case B recombination with uncertainties due to the unknown temperature, and circles showing extinction-corrected values. The solid curves in the lower three panels trace the calibrations from Curti et al. (2020), with the relative uncertainties.
Other Images in This Article

Copyright and Terms & Conditions
© 2021. The American Astronomical Society. All rights reserved.