Image Details
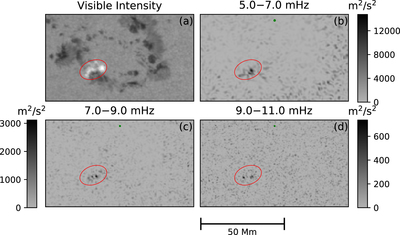
Caption: Figure 1.
Source density maps of the acoustic transient released by the flare SOL2011-07-30T02:04-M9.3 at 02:04 UTC on 2011 July 30. Panel (a) shows the HMI continuum intensity at the onset of the flare with the transient component enhanced by a factor of 5.0 in the elliptical region. Panels (b), (c), and (d) are source density maps of the acoustic transient released into the solar interior in 2 mHz bands centered at 6, 8, and 10 mHz, respectively. Units of source density are m2 s−2. Green filled circles near the tops of panels (b), (c), and (d) indicate diffraction limits of our diagnostic in its responses to artificial point sources at the base of the photosphere radiating at frequencies of 6, 8, and 10 mHz, respectively, from that horizontal location.
Other Images in This Article
Copyright and Terms & Conditions
© 2020. The American Astronomical Society. All rights reserved.