Image Details
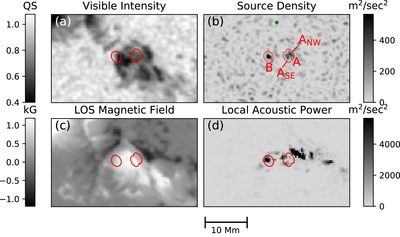
Caption: Figure 2.
10 mHz source density distribution rendered in Figure 1(d) (panel (b)) is compared with cospatial preflare continuum (panel (a)) with the mean local quiet Sun (“QS”) scaled to unity, the los magnetic field (panel (c)), and the local 10 mHz acoustic power (panel (d)). Transient source B (panel (b)) sits on the northeastern boundary of the north-polar umbra; kernels ASE and ANW of source A straddle a sharp magnetic boundary in the penumbra separating the northern and southern magnetic umbrae, across which the los magnetic field increases from ∼900 Gauss (kernel ASE) to ∼1150 Gauss los (ANW). Los magnetic induction (panel (c)) is rendered in kGauss. The mean local acoustic power is highly saturated in panel (d), its greatest value being 130,000 m2 s−2. Green filled circle near top of panel (b) indicates the diffraction limit of our diagnostic in its response to an artificial 10 mHz point source at the base of the photosphere at that horizontal location.
Other Images in This Article
Copyright and Terms & Conditions
© 2020. The American Astronomical Society. All rights reserved.