Image Details
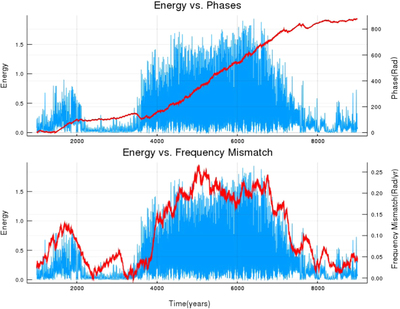
Caption: Figure 2.
Top panel: the time evolution of the amplitude ﹩| {A}_{2}(t)| ﹩ of Mode 2 (blue line) and the modal phase difference ﹩\delta \phi (t)={\phi }_{3}(t)-{\phi }_{2}(t)-{\phi }_{1}(t)+{\phi }_{4}(t)-{\phi }_{5}(t)﹩ (brown line) referred to the same numerical integration illustrated in the left panel of Figure 1 (i.e., for the value of the forcing parameter ﹩{f}_{3}=2.08\times {10}^{-17}﹩), but over a shorter period around a prevalent low-energy state. Bottom panel: the time evolution of ﹩| {A}_{2}(t)| ﹩ is plotted together with the instantaneous frequency mismatch δω (see the text). The frequency mismatch is divided by 10 in order to fit the same scale as the amplitude. It is observed that the modal phases become locked for an extended period of time when the energy is very low, unlike the periods of very strong activity in which the phase difference grows faster.
Other Images in This Article
Copyright and Terms & Conditions
© 2020. The American Astronomical Society. All rights reserved.