Image Details

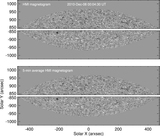
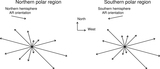
Caption: Figure 2.
Left panel: the distribution of low-field pixels in the solar polar region (black line) and the corresponding Gaussian fitting (red line). Right panel: the variation of the LOS field from solar disk center to solar limb.
Other Images in This Article
Copyright and Terms & Conditions
© 2020. The Author(s). Published by IOP Publishing Ltd on behalf of the American Astronomical Society.
Copyright ©
2026 Astronomy Image Explorer. All Rights Reserved.