Image Details
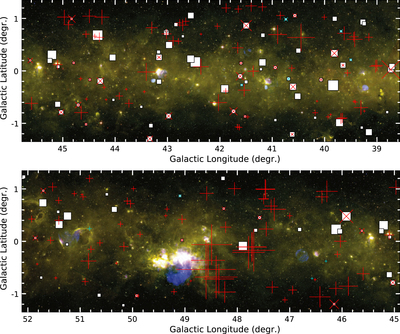
Caption: Figure 4.
Section of the THOR survey in the region 39° < ℓ < 52°. The background image is a false-color representation of Midcourse Space Experiment 8 μm, WISE 4.6 μm, 12 μm, 22 μm, and THOR + VGPS radio continuum. H II regions appear as pink or bright yellow nebulae, while supernova remnants appear as blue nebulae. Symbols indicate RM (+ for THOR extragalactic sources and × for pulsars) with size proportional to ﹩| \mathrm{RM}| ﹩ up to 4219 rad m−2, with red indicating positive and cyan indicating negative RM. Pulsar DMs are indicated by white squares, scaled proportional to DM, with the largest squares indicating DM ≈ 650 pc cm−3 (see Figure 3). The THOR latitude range is within the 1.8 kpc scale height of the WIM (Gaensler et al. 2008) at any distance within the Milky Way.
Other Images in This Article
Copyright and Terms & Conditions
© 2019. The American Astronomical Society. All rights reserved.