Image Details
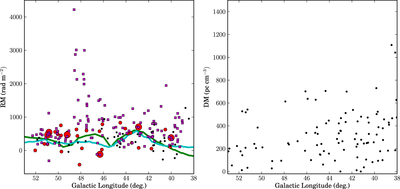
Caption: Figure 3.
RMs (left panel) and pulsar DMs (right panel) in the range 39° < ℓ < 52°. The new THOR data are shown as magenta squares. Red dots indicate RM of extragalactic sources from Van Eck et al. (2011), with larger dots representing sources in the latitude range of THOR. The green curve shows Galactic RM predictions at b = 0° from Oppermann et al. (2015), and the cyan curve shows the same from Hutschenreuter & Ensslin (2019) for their model that includes free–free emission as a proxy of Faraday rotation amplitude. The black dots show data for pulsars in the THOR survey from the Australia Telescope National Facility (ATNF) pulsar database (Manchester et al. 2005), updated online version http://www.atnf.csiro.au/research/pulsar/psrcat.
Other Images in This Article
Copyright and Terms & Conditions
© 2019. The American Astronomical Society. All rights reserved.