Image Details
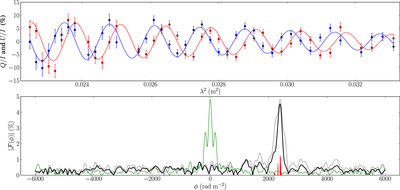
Caption: Figure 1.
Faraday rotation of G48.561−0.364, the fifth highest RM in the sample. The top panel shows Stokes Q (blue) and U (red) as a function of λ2 with the result of QU fitting, adopting a depolarizing turbulent foreground screen model with Faraday depth dispersion σϕ, ﹩{ \mathcal P }={{ \mathcal P }}_{0}\exp [-2{\sigma }_{\phi }^{2}{\lambda }^{4}-2i\phi {\lambda }^{2}]﹩ (Sokoloff et al. 1998). The bottom panel shows the dirty Faraday depth spectrum (gray), the RMTF with amplitude scaled to the strength of the signal (green, centered on ϕ = 0 rad m−2), the RM Clean deconvolved Faraday depth spectrum ﹩| { \mathcal F }| ﹩ (black), and RM clean components in red.
Other Images in This Article
Copyright and Terms & Conditions
© 2019. The American Astronomical Society. All rights reserved.