Image Details
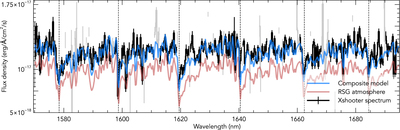
Caption: Figure 3.
X-shooter data (black, with errorbars) in the 1575–1700 nm region containing several strong absorption features, most prominent of which are the CO bandheads (indicated with black dashed lines). Data points that are affected by strong telluric emission lines are plotted in gray. Overplotted are the best-matching MARCS model atmosphere (red) and the composite model including an 1100 K blackbody to account for excess emission (blue).
Other Images in This Article
Copyright and Terms & Conditions
© 2019. The American Astronomical Society. All rights reserved.
Copyright ©
2026 Astronomy Image Explorer. All Rights Reserved.