Image Details
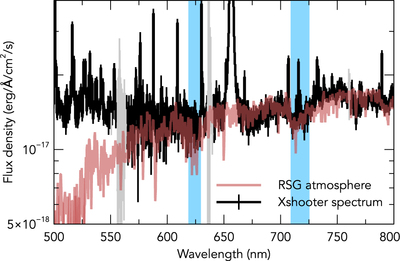
Caption: Figure 2.
X-shooter data (black, with errorbars) in the 500–800 nm region containing TiO absorption features (indicated by the blue shaded regions; only the feature at 720 nm is visible in the data). Data points with low signal-to-noise ratio (S/N) are plotted in gray. The best-matching MARCS model atmosphere is overplotted in red. Blueward of 650 nm the data start to deviate from the model atmosphere—an extra model component is necessary to fit this excess blue emission.
Other Images in This Article
Copyright and Terms & Conditions
© 2019. The American Astronomical Society. All rights reserved.
Copyright ©
2026 Astronomy Image Explorer. All Rights Reserved.