Image Details
Caption: Figure 1.
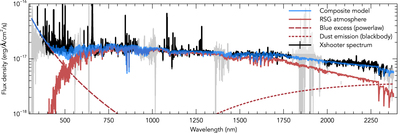
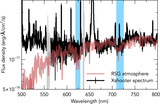
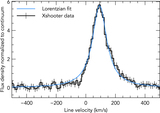
Full X-shooter spectrum (black, with errorbars) with areas heavily affected by telluric emission lines shown in gray. Overplotted are the best-matching MARCS model atmosphere (solid red line), a 1100 K blackbody to account for excess red emission (red dotted line) and a power law with α ≈ 4 to account for excess blue emission (red dashed line, although the shape of this component is not well constrained and can also be fit with a blackbody with T ≳ 20,000), as well as the sum of those three models (blue line). The large majority of positive outliers shown in black are emission lines, not noise.
Other Images in This Article
Copyright and Terms & Conditions
© 2019. The American Astronomical Society. All rights reserved.
Copyright ©
2026 Astronomy Image Explorer. All Rights Reserved.