Image Details
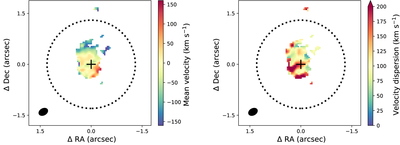
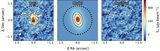
Caption: Figure 4.
Mean velocity (left panel) and velocity dispersion (right panel) fields of the [C II] line for J1342+0928. These quantities are estimated by fitting a Gaussian profile to the [C II] spectrum of each individual pixel. Here the mean velocity is the location of the peak of the Gaussian fit, and the velocity dispersion is the square root of the variance of the Gaussian profile. Only those pixels that have a 3σ detection in the integrated [C II] flux (see Figure 2) are displayed. The black dotted circles mark the region used to measure the total flux densities (see Figure 2), and the synthesized beam is shown in the bottom left. The black cross marks the position of the quasar.
Other Images in This Article
Copyright and Terms & Conditions
© 2019. The American Astronomical Society. All rights reserved.