Image Details
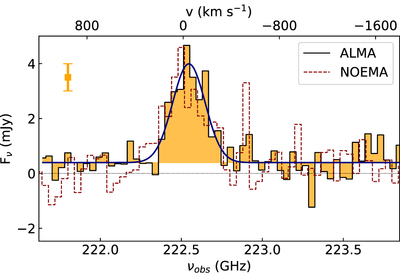
Caption: Figure 1.
Spatially integrated [C II] spectrum of the quasar J1342+0928 within an aperture of 1.″3 radius. Standard deviation of the flux measurement is shown on the left. The blue line is a fit to the data consisting of a Gaussian on top of a flat continuum. The upper axis shows velocities centered at z = 7.5413 as reported in Venemans et al. (2017b), which is consistent with the value measured here from the ALMA data: z = 7.5400 ± 0.0003. Their NOEMA spectrum is also shown with a dashed line.
Other Images in This Article
Copyright and Terms & Conditions
© 2019. The American Astronomical Society. All rights reserved.
Copyright ©
2026 Astronomy Image Explorer. All Rights Reserved.