Image Details
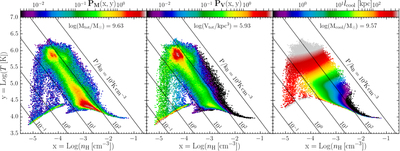
Caption: Figure 3.
Phase diagrams for the gas at z = 4 in region F from Figure 1. The left and center panels show the mass- and volume-weighted distributions, respectively. The total mass and total volume are listed in each panel. The color represents a normalized probability density, such that the integral of ﹩{\boldsymbol{P}}(x,y){dx}\,{dy}﹩ over the full range of parameter space equals unity, where x = log(nH) and y = log(T). Diagonal lines show constant thermal pressure, from Pth/kB = 0.1–1000 K cm−3, as marked. The adiabat of the preshock gas is visible at low densities and low temperatures. Following the shock, the gas concentrates along an isobar with Pth ∼ 50 K cm−3. Two phases are clearly visible, with most of the mass/volume having (nH, T) ∼ (10−3 cm−3, 104.5 K)/(10−4.5 cm−3, 106 K). The right panel shows the cooling length, lcool = cs tcool, for gas in the same region, considering only gas undergoing net cooling. The total mass of the cooling gas is listed. The cooling length in the postshock gas with T ∼ 2 × 10⁵ is lcool ∼ 10 kpc, while in the cold phase it is ∼1 kpc.
Other Images in This Article
Copyright and Terms & Conditions
© 2019. The American Astronomical Society. All rights reserved.