Image Details
Caption: Figure 2.
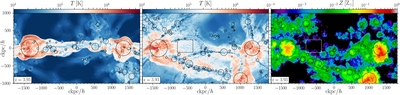
Left and center: temperature maps of the system at z = 4, in the same frame as panels (D) and (E) of Figure 1. We show the density-weighted average temperature along the line of sight, integrated over ±400 h−1 ckpc. The accretion shock at the sheet edge is clearly visible in the edge-on view. In the face-on view, the filaments appear cold while the sheet regions have a multiphase structure with hot and cold regions owing to thermal instability. Right: metallicity map in the same frame as the center panel. The filaments are enriched to Z ≳ 10−2Z⊙, while the sheet regions retain Z < 10−3Z⊙. An animation of the temperature evolution from z = 6.84 to z = 2.05, density-weighted in the same edge-on and face-on projections of the large-scale sheet, is available. The left and center panels represent a still frame of the animation at z = 3.93.
(An animation of this figure is available.)
The video/animation of this figure is available in the online journal.
Other Images in This Article
Copyright and Terms & Conditions
© 2019. The American Astronomical Society. All rights reserved.