Image Details
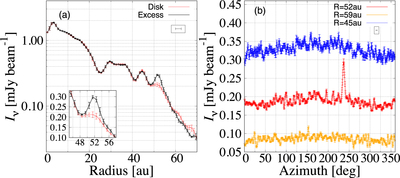
Caption: Figure 2.
Deprojected radial and azimuthal profiles of the 233 GHz continuum emission. The bar at the top-right corner in the box shows the FWHM of the synthesized beam. The error bars are determined from the standard error through the averaging. (a) Radial profile running through the emission feature (P.A. = 236°–238°) is shown in black. The red line represents the radial profile averaged over the neighborhood of the emission feature (P.A. = 222°–236° and 238°–252°). The panel at the bottom left corner of the left panel shows the close-up view of the radial profile around 52 au on a linear scale. (b) Azimuthal profiles of the emission at radii of 52, 59, and 45 au are shown in red, yellow, and blue, respectively.
Other Images in This Article
Copyright and Terms & Conditions
© 2019. The American Astronomical Society. All rights reserved.