Image Details
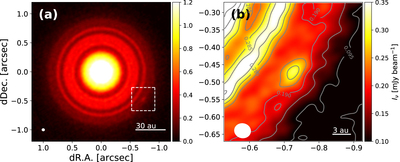
Caption: Figure 1.
233 GHz continuum maps. The white ellipse at the bottom left corner of each panel indicates the beam size of the synthesized images. (a) Overall distribution of the 233 GHz continuum emission. (b) Close-up view of the ﹩0\buildrel{\prime\prime}\over{.} 4\times 0\buildrel{\prime\prime}\over{.} 4﹩ box including the emission feature (white box in the main panel). The contour interval is 5σ, where 1σ = 9.1 μJy beam−1.
Other Images in This Article
Copyright and Terms & Conditions
© 2019. The American Astronomical Society. All rights reserved.
Copyright ©
2026 Astronomy Image Explorer. All Rights Reserved.