Image Details
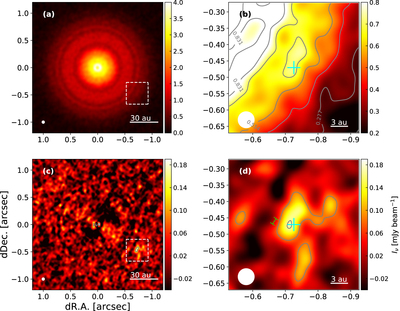
Caption: Figure 4.
325 GHz continuum map at 50 mas resolution made from the publicly available data. The white ellipse in the bottom left corner of each panel indicates the beam size of the images. (a) Overall distribution of the emission. (b) Close-up view of the box with white dotted lines in the panel (a). The contour interval is 5σ, where 1σ = 27.7 μJy beam−1. The cross in cyan indicates the peak position of the emission feature identified in our 233 GHz image. (c) Residual emission after the subtraction of the axisymmetric component from the overall image. The ±5σ contour is shown. (d) Close-up view of the box with white dotted lines in the panel (c). The contour starts at ±3σ with an interval of 3σ. The green line on the left of the emission feature indicates the expected Keplerian motion at 52 au for 2 yr.
Other Images in This Article
Copyright and Terms & Conditions
© 2019. The American Astronomical Society. All rights reserved.