Image Details
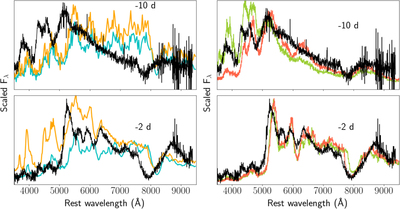
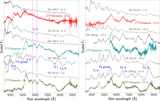
Caption: Figure 6.
Comparison of the spectra of ZTF 18aaqeasu at and before peak light (shown as black lines) to models of He shell double detonations from Kromer et al. (2010; the left panels are for the two models shown in the light curve comparison) and Polin et al. (2019; the right panels are for two cases of ejecta mixing with the best-fit WD and shell mass from the light curves). In both panels, the epochs of spectroscopic comparison are indicated according to the phase of the light curve (days from r-band peak), and the model spectra have the same color scheme as in Figure 5.
Other Images in This Article
Copyright and Terms & Conditions
© 2019. The American Astronomical Society. All rights reserved.
Copyright ©
2026 Astronomy Image Explorer. All Rights Reserved.