Image Details
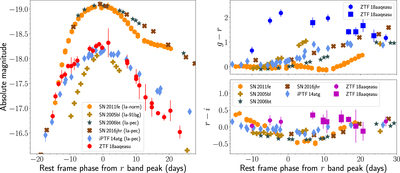
Caption: Figure 3.
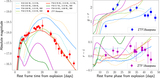
Left panel: comparison of the r-band light curve of ZTF 18aaqeasu to other normal and sub-luminous SNe Ia. Right panel: comparison of the g − r and r − i color evolution of ZTF 18aaqeasu (circles are colors derived from spectra, while squares denote colors from photometry) to the same sample of SNe as in the left panel.
Other Images in This Article
Copyright and Terms & Conditions
© 2019. The American Astronomical Society. All rights reserved.
Copyright ©
2024 Astronomy Image Explorer. All Rights Reserved.