Image Details
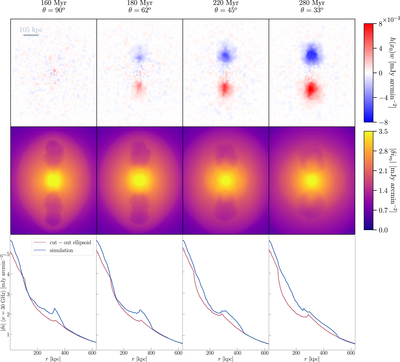
Caption: Figure 3.
The top row shows the integrated kinetic SZ effect h(x0)w at frequency ν0 = 30 GHz. The panels in the middle row show the thermal SZ signal for bubbles, which are filled with a relativistic power-law electron distribution. The angle of inclination θ between jet axis and line of sight is decreased from left to right. The images have dimensions 1000 kpc × 750 kpc and are centered on the BH. At low angles, i.e., θ = 33°, the kinetic SZ signal can reach values of up to 10% of the total SZ signal. The lower panel shows profiles of the SZ signal along the jet axis of the simulated bubbles (blue) and the cut-out model (red). While the model matches the simulations at the inner bubble edge for high values of inclinations, it differs significantly for lower inclinations as CMB photons intersect a larger portion of the ellipsoidal shocked cocoon including the central dense cool core region.
Other Images in This Article
Copyright and Terms & Conditions
© 2019. The American Astronomical Society. All rights reserved.