Image Details
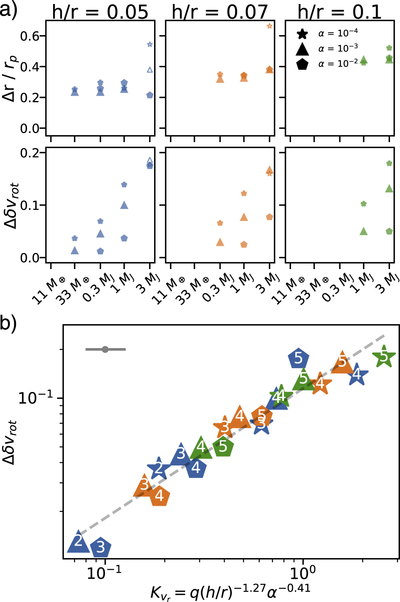
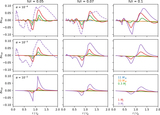
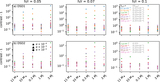
Caption: Figure 5.
Panel (a): upper panels show the radial distance between the positions of δvrot maximum and minimum peaks (Δr). Bottom panels show the difference between δvrot at its maximum and minimum values (Δδvrot). The star, triangle, and pentagon markers represent models with α = 10−4, 10−3, and 10−2, respectively. The unfilled markers are eccentric cases the same as in Figures 2 and 4 shown in dashed lines. Panel (b): the fitting formula (Equation (16)) with all measured Δδvrot in panel A. The numbers inside the symbols represent cases with different planet masses in ascending order (e.g., “1” stands for 11 M⊕). The errorbar is shown in the upper-left corner.
Other Images in This Article
Show More
Copyright and Terms & Conditions
© 2018. The American Astronomical Society. All rights reserved.