Image Details
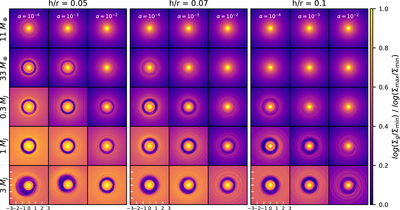
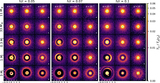
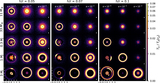
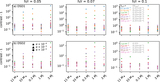
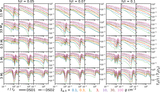
Caption: Figure 1.
Two-dimensional gas surface density in log scale for h/r = 0.05, 0.07, and 0.1 from left to right panel blocks. In each block, the models for α = 10−4, 10−3, 10−2 are shown from left to right. The planet mass increases from top to bottom, namely Mp = 11 M⊕, 33 M⊕, 0.3 MJ, 1 MJ and 3 MJ, if M* = M⊙. In each panel, the star is located at the center, and the plotting region is 3 × 3 in units of rp, where rp is the distance between the star and the planet. The planet is located at (x, y) = (1, 0) and orbits counterclockwise around the star. Σmax and Σmin are chosen to highlight the structures in each panel.
Other Images in This Article
Show More
Copyright and Terms & Conditions
© 2018. The American Astronomical Society. All rights reserved.