Image Details
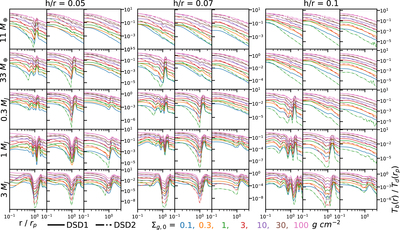
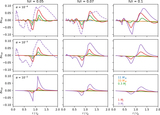
Caption: Figure 10.
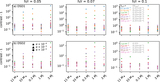
“Normalized” radial intensity profile for cases with h/r = 0.05 (left panels) h/r = 0.07 (middle panels), and h/r = 0.1 (right panels). From left to right in each panel block, α = 10−4, 10−3, 10−2 in disks. From top to bottom, the planet mass increases (the layout is similar to Figures 1, 6, and 7). The solid curves are calculated with the DSD1 dust size distribution, while the dotted–dashed curves are calculated with the DSD2 dust size distribution. The seven colors of lines denote different initial gas surface densities (Σg,0). The profiles are smoothed with a Gaussian kernel with σ = 0.06 rp.
Other Images in This Article
Show More
Copyright and Terms & Conditions
© 2018. The American Astronomical Society. All rights reserved.
Copyright ©
2024 Astronomy Image Explorer. All Rights Reserved.