Image Details
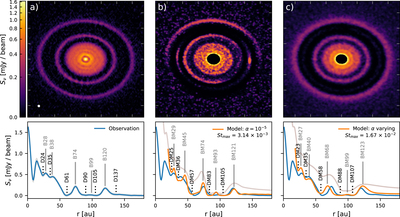
Caption: Figure 19.
Top panels: (a) the observation image of AS 209 (see Guzmán et al. 2018, Huang et al. 2018a). The distance between two ticks on the axes is 40 au. (b) The synthetic image from the simulation with a single planet (Mp/M* = 0.1 MJ/M⊙) at 99 au in a α = 10−5, Σg,0 = 15 g cm−2, smax = 0.3 mm, and p = −3.5 disk at 2000 orbits (∼2 Myr). (c) The synthetic image from the simulation with a single planet (Mp/M* = 0.1 MJ/M⊙) at 99 au in a varying α, Σg,0 = 6.4 g cm−2, n(s) ∝ s−3.5, and smax = 0.68 mm disk at 1350 orbits (∼1.35 Myr). Bottom panels: the azimuthally averaged intensity profiles. Panel (a) is the profile from the observation, and (b) and (c) are the profiles from the simulations above. The “DM” and “BM” stand for dark annulus and bright ring in the model, respectively; the digits coming after mark the position in astronomical units. The gas density profiles of two models are overplotted on the bottom panels in gray in arbitrary units.
Other Images in This Article
Show More
Copyright and Terms & Conditions
© 2018. The American Astronomical Society. All rights reserved.