Image Details
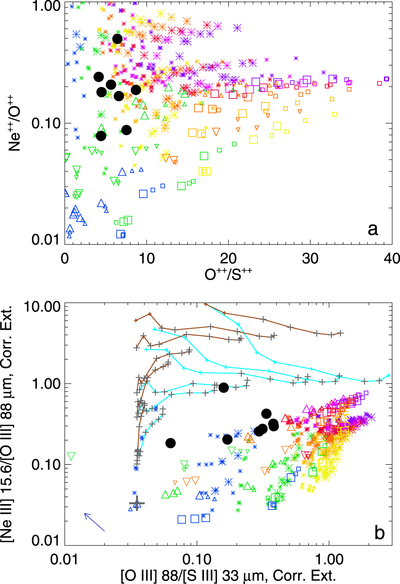
Caption: Figure 3.
Ionic and line ratios compared to models. In both panels, the black dots are our observed positions as described in the text and listed in Table 1. The asterisks are models from S18 computed with Cloudy (Ferland et al. 2017) with O/S = 36 and Ne/O = 0.25, ionizing SEDs from Starburst99 (Leitherer et al. 2014), and extra X-rays represented by blackbodies with TBB = 106.5 K, where the colors signify the ages of the Starburst99 model SEDs: blue is 106.7 years, green is 106.65 years, yellow is 106.6 years, yellow-orange is 106.5 years, red-orange is 106.4 years, red is 106.3 years, magenta is 106.2 years, and purple is 106.0 years. Squares are newly computed models with input density = 300 cm−3, the same Starburst99 SEDs and otherwise the same input parameters but no X-rays, and the same color scheme. Upward- and downward-pointed triangles are similar models with supergiant and dwarf SEDs computed with WM-BASIC (Pauldrach et al. 2001) taken from the Binary Population and Spectral Synthesis (BPASS) project (Eldridge et al. 2017); the colors represent Teff equal to blue: 30,200 K, green: 32,300 K, orange: 34,600 K, red-orange: 37,200 K, and red: 40,000 K. For all models, the larger and smaller symbols represent models whose predicted [S III] 33/[Si II] 34 μm line ratios are within or outside the range of the observed ratio, 1.5–3.0, respectively. (a) The Ne++/O++ ratio vs. the O++/S++ ratio. (b) The [Ne III] 15.6/[O III] 88 μm line ratio vs. the [O III] 88/[S III] 33 μm line ratio, where the line intensities were corrected for extinction from S18. Recomputing the models plotted with asterisks for a higher Np = 300 cm−3 would have them move in the direction of the blue arrow. Following Ho et al. (2014), the cyan and brown lines are the result of adding shock emission from Allen et al. (2008; see the text). The gray crosses are combinations of models plus shocks that predict the [S III] 33/[Si II] 34 μm line ratio within the observed range.
Other Images in This Article
Copyright and Terms & Conditions
© 2018. The American Astronomical Society. All rights reserved.