Image Details
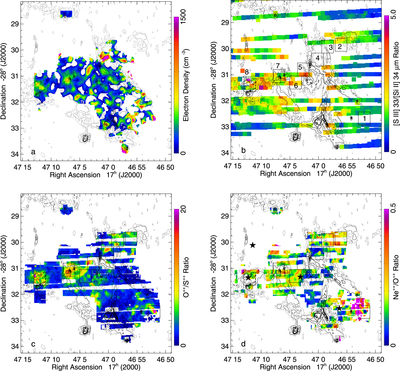
Caption: Figure 2.
Results from ionic abundance ratio calculations. The contours in each map are those of the 8.4 GHz VLA image from M92. (a) Computed electron densities from the [O III] 52/[O III] 88 μm line ratios. The colored areas are where both [O III] lines were observed and the line ratios have S/N ≥ 4. (b) The [S III] 33/[Si II] 34 μm line ratio map from S18 (demonstrating the incomplete Spitzer map coverage). The locations of the eight sub-regions discussed in Section 4.1 are plotted as the numbered black boxes. (c) The ionic O++/S++ ratio. (d) The ionic Ne++/O++ ratio. The large black stars show the locations of the O supergiant and the Wolf–Rayet (WR) stars identified by Mauerhan et al. (2010).
Other Images in This Article
Copyright and Terms & Conditions
© 2018. The American Astronomical Society. All rights reserved.