Image Details
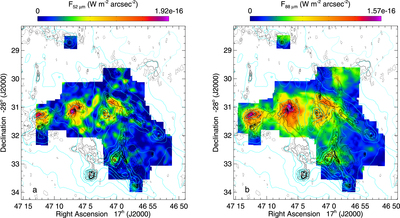
Caption: Figure 1.
Observed [O III] line intensities in Sgr B1. All but the darkest blue pixels have S/N > 3. The black contours are the 8.4 GHz Very Large Array (VLA) intensities from M92 and the cyan contours are the 70 μm Herschel Hi-GAL intensities (Molinari et al. 2011, 2016). (a) The [O III] 52 μm line (maximum intensity = 1.92 × 10⁻¹⁶ W m−2 arcsec−2). (b) The [O III] 88 μm line (maximum intensity = 1.57 × 10⁻¹⁶ W m−2 arcsec−2).
Other Images in This Article
Copyright and Terms & Conditions
© 2018. The American Astronomical Society. All rights reserved.
Copyright ©
2024 Astronomy Image Explorer. All Rights Reserved.